Market Update Q1 2023
Market summary
On March 22, the Federal Open Market Committee increased the funds rate by 25 basis points to a target range of 4.75%-5.00%. The Fed expressed a cautionary stance regarding further rate increases due to recent banking issues, while also stating quantitative tightening will continue at a rate of about $95 billion per month. Futures for federal funds show an equal chance of a pause or another 25-basis point rate increase at the May 2-3 meeting. However, central bankers have maintained a relatively upbeat assessment of the current state of the economy. Despite the Fed’s aggressive tightening of 475 basis points over the last 12 months, the labor sector remains robust with unemployment at 3.6%, while inflation remains elevated at 6.4% year over year. This has led policymakers to believe supply and demand imbalances are sufficient to threaten the Fed’s mandate of supporting stable prices.
In March, signs of stress within the banking sector emerged. Silicon Valley Bank experienced a run on core deposits, which they were unable to replace, resulting in the Federal Deposit Insurance Corp. taking action. Signature Bank and Silvergate experienced similar liquidity issues and were either taken over by regulators or forced to wind down operations. Concerns of contagion arose in the banking sector, with weakness in First Republic Bank requiring a consortium of large banks to join forces and infuse it with $30 billion in deposits. Federal regulators also stepped in and created a new lending facility that will allow financial institutions to borrow funds for up to one year by pledging collateral at par rather than currently depressed market values. Banks can now raise cash without selling assets at losses into a weakening market. The Fed briefly acknowledged these events at the March meeting, indicating they may lead to tightened credit conditions due to subsequently weaker economic activity.
While central bankers remain optimistic about the economic outlook, most economists believe a mild recession will occur by 2024. A recession coupled with declining inflation, rising unemployment and stress within the banking sector, may pressure the Fed to adjust course to avoid overtightening. Forecasters believe the first rate cut may occur sometime after mid-2023. However, look for the Fed to keep rates higher for longer if inflation lingers, unemployment remains sticky and/or economic activity continues to advance. The latest projections for 2023 from Fed officials forecast unemployment increases to 4.5% while real GDP expands by 0.4% with core PCE inflation at 3.6%.
The European Central Bank is on a similar path and recently raised interest rates by 50 basis points to 3%, while also promising emergency support for Eurozone banks. Policymakers there are seeking to combat high inflation without aggravating the financial system. While overall Eurozone inflation eased in February, it continued to accelerate for many of the largest members including Germany, France and Spain. Labor strikes and unrest across the region are pushing wages higher, making inflation stickier. Meanwhile, the Bank of England raised its key interest rate by another 25 basis points to 4.25%. Another rate hike is possible with futures suggesting a policy rate of 4.47% by mid-year.
The global growth outlook remains uncertain. Foreign economies are struggling with high inflation and central banks continue to raise interest rates despite emerging concerns about the banking sector. This may reduce economic activity and weaken labor markets. Russia’s invasion of Ukraine has led to significant challenges in Europe, including skyrocketing energy prices and increasing costs for both consumers and producers. Europeans are getting some relief as unseasonably warm winter weather allowed natural gas inventories to build and ease prices. Global supply chain conditions have greatly improved from peak pandemic disruption levels. Increasing tensions between the U.S. and China create immense uncertainty regarding trade flows and market access. In response, many businesses are considering and/or actively pursuing new strategies related to production, procurement and target markets. These shifting dynamics will likely evolve over the next several years.
Protests in China against zero-COVID policy initially resulted in modest easing of social and economic restrictions; however, it appears the unrest caused the Chinese Communist Party to lift nearly all restrictions. While many expect global demand for raw materials, energy and logistics capacity to gradually increase in response, demand and prices have recently fallen as investors and traders increasingly worry about a global recession.
View on interest rates
After aggressive tightening by the Fed over the past year, we are finally starting to see a shift towards more accommodative policy. The most recent dot plot from March shows rates peaking in 2023 and coming down a full percentage point in 2024. This likely means the Fed expects economic deterioration and has rate cuts on its radar. With the Fed only signaling one more quarter-point hike in 2023, and the possibility of rate cuts, we are likely to see a flattening of the yield curve and a move away from the inversion we have seen over the past several months. Continued rate volatility is expected as the markets position themselves for the new rate environment and we should see new trading ranges established.
Interest rates review
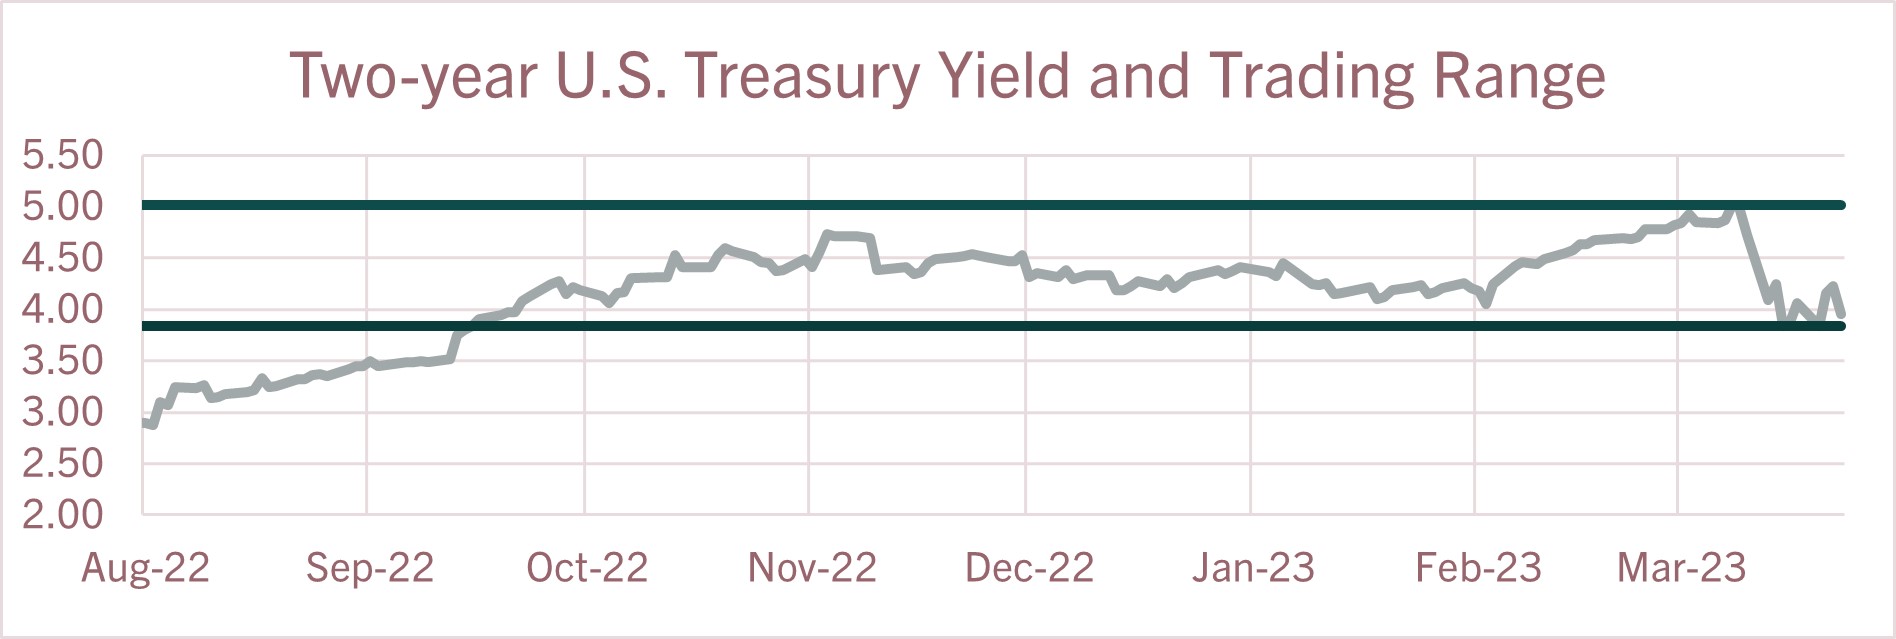
| U.S. Treasury Yields | The two-year U.S. Treasury yield rose to 5.06% but recently tumbled to around 3.80%. The current yield is now trading at the bottom of the six-month trading range of 3.80%-5.06%, driven mainly by the Fed’s pivot to more accommodative monetary policy. Shorter-term yields will remain sensitive to expected monetary policy action (or in-action). The spread between the two-year and 10-year Treasury yields is around -38 basis points, and points to signs of a flattening yield curve. Look for the yield curve to eventually return to a normal, upward-sloping curve as we see further downward pressure on the short-end rates. 
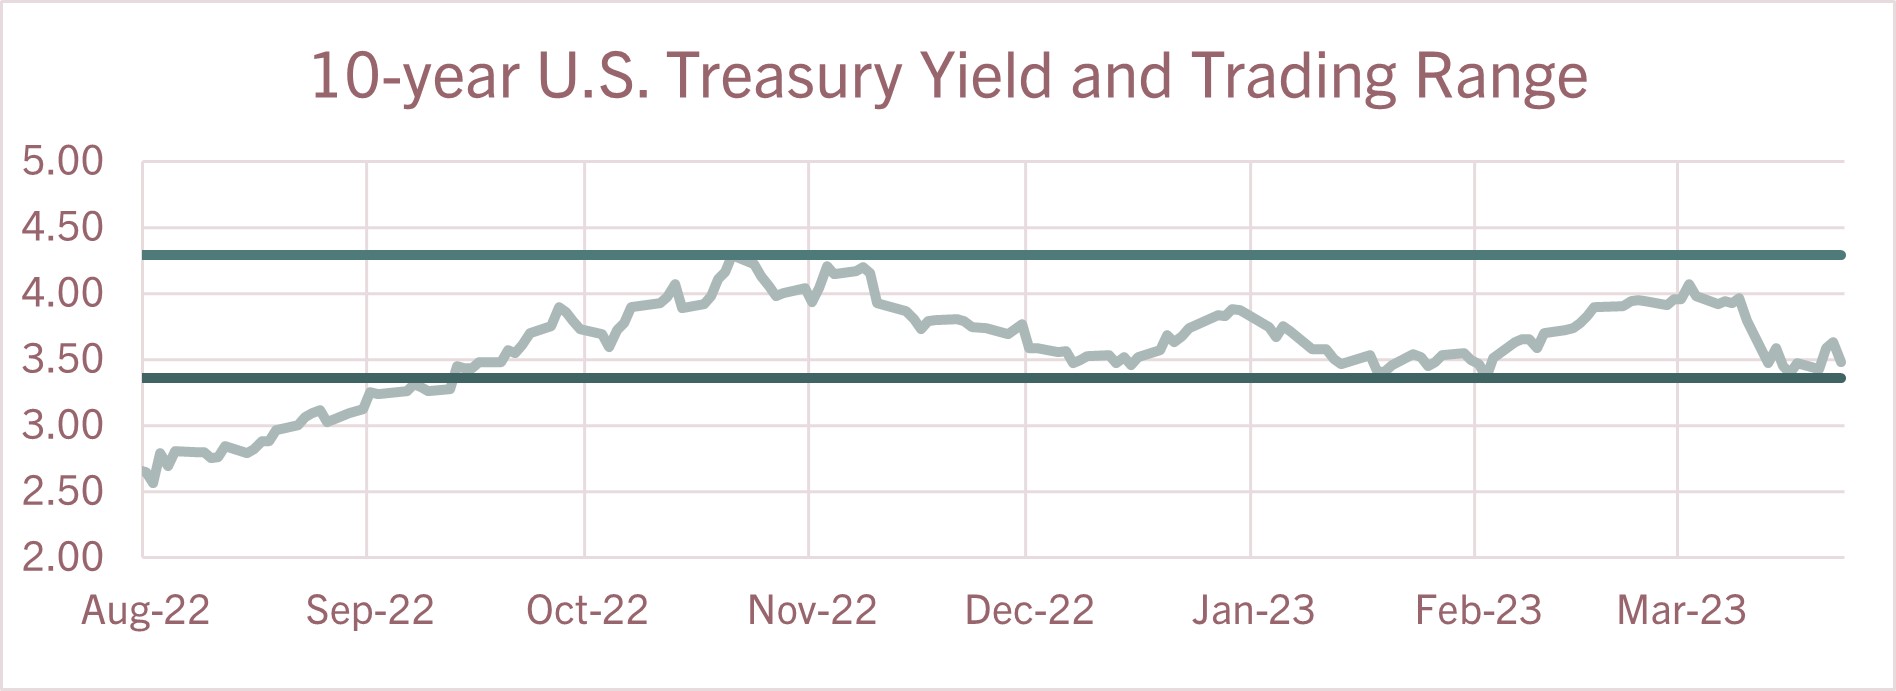
The six-month trading range for the 10-year Treasury yield is 3.37%-4.25%. We have seen downward pressure on the 10-year yield as inflation shows signs of easing and the probability of a recession rises. Market participants will be the main driver of yield moves as they digest signs of weaker growth, lower inflation and rising unemployment, all of which could continue to push long-term yields lower.  |
Economic highlights
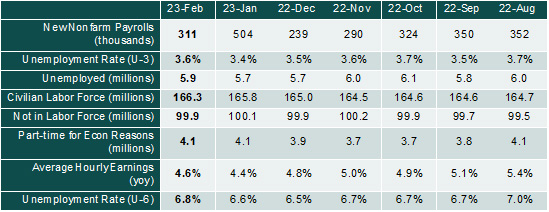
| Employment | Nonfarm payrolls continue to grow, albeit at an increasingly slower rate. Payrolls gained 311k in February and leisure and hospitality saw the largest increase (33.8% of total payrolls added), followed by health care and social assistance (20.2%), retail trade (16.1%), government (14.8%) and construction (7.7%). Notable declines were observed in the information and transportation and warehousing industries. Adjustments to the December 2022 and January 2023 payroll data were minor. Despite gains in payrolls, unemployment numbers edged up in February. The unemployment rate and the number of unemployed persons increased by 0.2% (to 3.6%) and 242k (to 5.9 million), respectively. Simultaneously increasing payroll and unemployment levels may be the result of people reentering the workforce as the labor force participation rate increased to 62.5% (this marks the third month of consecutive gains). In addition, the amount of multiple job holders has steadily increased and is almost back to pre-pandemic levels. A person who got a second or third job would register a payroll gain but would not reduce unemployment data. Average hourly earnings increased modestly to $33.09 in February, representing a 4.6% year-over-year increase in nominal terms but a 1.4% decrease when adjusted for inflation. Growth in wages (a major focus for the Fed) is experiencing a modest slowdown. Leading indicators suggest the labor market will remain strong throughout 2023. Initial and continuing weekly jobless claims continue to trend sideways at relatively low levels. Job openings have been generally flat since November but are down from the peak levels reached in March 2022. Overall, significant gains in payrolls should offset slight increases in unemployment and declines in real wages (wages net of inflation) and may indicate some businesses are not as active in the labor market as data suggests.

|
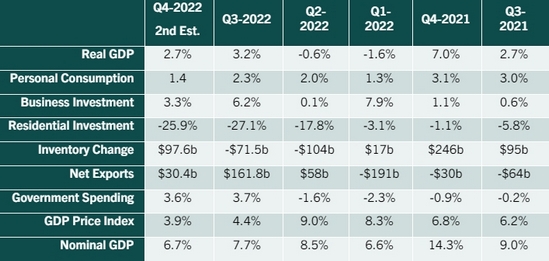
| Economic Growth | Gross Domestic Product: The second estimate for 2022 Q4 GDP was 2.7%. The largest positive growth factor was a gain in private inventories (a measure of the change in physical volume held by private entities), particularly among petroleum and coal products. Inventory measures are volatile from quarter to quarter and gains/losses often precede a slowdown/ramp-up in economic activity. Other positive drivers for GDP included service consumption in health care and housing/utilities and government spending. Several sectors of the economy contracted in the Q4 GDP report, the most significant was a decline in fixed residential investments. This aligns with data showing single-family housing starts fell in 2022. In addition, the trade balance worsened with lower exports and rising imports. Other components of Q4 GDP provided mixed signals. Subcomponents of goods consumption saw both moderate gains and losses. Other than health care and housing/utilities, household consumption may be signaling declining trends in food services and accommodations, financial services and insurance, and other services. Within fixed investments, gains in software, intellectual property and transportation equipment were balanced out by losses in information processing equipment. Economic data are mixed and suggest GDP will continue to grow in 2023 Q1 (advanced estimate will be released on April 27) but may contract later in the year. Retail sales remain strong but have flattened out and may begin to weaken given rising consumer loan delinquency rates and record levels of credit card debt. Housing permits increased in February; however, home prices and interest rates remain elevated and will likely pressure fixed-residential investments. Manufacturing activity exceeded expectations in January and February, but many expect the sector to continue contracting. Fed policy will be an important driver in 2023. While tightening monetary policy characterized 2022, this may change if the economy slows, unemployment rises and/or the financial system shows signs of stress. A falling interest rate environment and/or the reinstitution of quantitative easing may provide support to the economy. 
|
| Consumer Inflation | Consumer Price Index (CPI): Compared to the prior month, consumer inflation for February rose 0.4%. Food advanced 0.4% and energy prices declined 0.6%. Both gas and electricity prices rose 1%. Core inflation (excludes food and energy) came in higher at 0.5% as shelter costs, which typically have reporting lags, rose 0.7%. Offsetting some of these increases were declines in used car prices, fuel oil, and natural gas. On a year over year basis, overall consumer inflation is up 6.0% with core inflation up 5.5%. An indirect input to inflation is labor costs. The monthly reading for year-over-year average hourly earnings has been 4.3% or higher since August 2021. Meanwhile, the annual shelter cost index continues to move higher, rising 8.8% year over year in February. The stubbornly robust shelter component is consistent with the long historical lag between actual rents and the imputed rent in CPI. Labor and housing comprise significant components of the inflation calculation and until we see meaningful declines, inflation will likely remain above the Fed’s 2% target.

|
| Monetary Policy | The table below summarizes recent decisions regarding monetary policy action by the Federal Open Market Committee. The next FOMC meeting is scheduled for May 2-3. Federal funds futures indicate an equal chance for either a pause or another 25-basis point rate increase. Directives to the Open Market Desk at the Federal Reserve Bank of New York  |
The above commentary is a summary of select economic conditions prepared for AgWest Farm Credit management. It is being shared as a courtesy. As with any economic analysis, it is based upon assumptions, personal views and experiences of those who provided the source material as well as those who prepared this summary. These assumptions, conclusions and opinions may prove to be incomplete or incorrect. Economic conditions may also change at any time based on unforeseeable events. AgWest assumes no liability for the accuracy or completeness of the summary or of any of the source material upon which it is based. AgWest does not undertake any obligation to update or correct any statement it makes in the above summary. Any person reading this summary is responsible to do appropriate due diligence without reliance on AgWest. No commitment to lend, or provide any financial service, express or implied, is made by posting this information.
.jpg?Status=Master&sfvrsn=f5a01684_1)
Looking to build your knowledge base?
AgWest offers a wide variety of educational materials to help you manage your business and grow your best future.
Learn more.jpg?sfvrsn=e8bfac6b_0)