Market Update Q3 2023
Executive summary
The Federal Open Market Committee left the federal funds target rate unchanged in September but signaled additional tightening may be appropriate later in the year. Federal Reserve (Fed) officials are seeing continued labor strength and elevated inflation. While the banking sector has struggled in 2023 and credit conditions have tightened, Fed officials indicated they believe the banking system is “sound and resilient.” Meanwhile, market concerns include the threat of a labor strike by the United Auto Workers, stress within the commercial real estate sector, a “higher for longer” bias in interest rates by the world’s central bankers and a market view that growth will begin to weaken over the next six to 12 months. The amount of government and corporate debt maturing over the next one to two years is significant and may limit interest rate declines as investors require higher yields. Furthermore, this may greatly increase interest costs for some businesses and governments and threaten solvency if they are unable to pass on the higher costs to customers.
Federal Reserve pauses rate hikes
As was expected, the FOMC left the federal funds target rate range at 5.25%-5.50% at their September meeting. The Fed's revised economic projections forecast core PCE (personal consumption expenditures) inflation will finish the year near 3.7% compared to the current level of 4.2%. Federal Reserve Chair Jerome Powell indicated policymakers remain committed to the 2% target for core PCE, which will be achieved by maintaining policy rates at a sufficiently restrictive level. The monetary policy statement suggested the committee will monitor a wide range of data points “including readings on labor market conditions, inflation pressures and inflation expectations, and financial and international developments.” The stance of monetary policy will be adjusted as necessary to attain the committee’s goals.
A tight labor sector coupled with elevated core inflation (see sections below) fueled the hawkish comments by the Fed. Policymakers believe supply and demand imbalances could threaten the Fed’s mandate to bring down inflation. The Fed expects credit conditions to tighten for households and businesses, which will weigh on economic activity, hiring and inflation. There is no clear indication what the extent of the credit tightening may be, but the Fed is determined to meet its goal of maximum employment and 2% inflation. To achieve this, the Fed weighs inflation against labor market data to guide monetary policy decisions while also continuing to reduce the Fed’s balance sheet (quantitative tightening) at a rate of about $95 billion per month.
The Fed’s dot plot indicated the median forecast for the fed funds rate would finish the year at 5.75%, with many officials believing the policy tightening cycle is nearly complete. The Fed’s projections suggest one more 25-basis point rate hike in November or December. Federal funds futures indicate the Fed may be done increasing rates. According to the CME Fed Watch Tool, the chances of a November rate hike are 28% while the probability of an increase in December is around 40%.
Mild recession expected
Most economists believe a mild recession will occur in 2024 which is in line with market expectations as futures suggest the first rate cut occurring possibly in the second half of the year. A recession coupled with declining inflation, rising unemployment and banking sector stress may pressure the Fed to adjust course to avoid overtightening. The Fed may keep rates higher for longer if inflation lingers, unemployment remains sticky and/or economic activity continues to advance. The Fed forecasts unemployment rising to 3.8%, GDP expanding to 2.1% and inflation increasing to 3.7% for 2023. Meanwhile, the Fed seems to be holding out for a soft landing as 2024 GDP is projected to grow at 1.5%, unemployment up to 4.1%, core PCE inflation down to 2.6% and two 25 basis point rate cuts to a 5.25% fed funds rate.
Commercial real estate sector stressed
The office space segment within the commercial real estate sector is under pressure due to elevated interest rates and reduced occupancy rates. Valuations are down and lenders with significant exposure in this space may suffer losses. Many economists believe the sector has strong fundamentals outside the office space segment.
Global economy decelerates
Global growth is decelerating, with estimates between 2.8% and 3.0% for 2023 (approximately 15% to 20% below 2022). Rising interest rates by central banks continue to weigh on economies. Inflation projections for 2024 were revised up from earlier this year, suggesting rates could remain higher for longer. Energy prices have also risen significantly over the last two months (see Crop Inputs Snapshot for more information) and this could further pressure inflation and weaken economic activity.
The war in Ukraine continues to create uncertainty and shift global trade flows; however, the recent offensive against Russian lines has been largely unsuccessful, suggesting Ukrainian forces may be losing steam. While some hope the war will come to an end soon, it remains unclear what the fallout will be in terms of territorial losses/gains and trade dynamics.
The BRICS (a bloc of countries, including Brazil, Russia, India, China and South Africa, focused on strengthening economic and political ties) summit in South Africa made headlines as six new countries joined, three of which are large oil producers (Saudi Arabia, United Arab Emirates and Iran). One of the priorities coming out of this event is the development of a mechanism to facilitate trade in currencies other than the U.S. dollar. While still very early in the process and fraught with technical and geopolitical challenges, a shift towards using other currencies in global trade could increase the cost of U.S. imports and reduce U.S. political and economic influence abroad.
Interest rates review
| U.S. Treasury Yields |
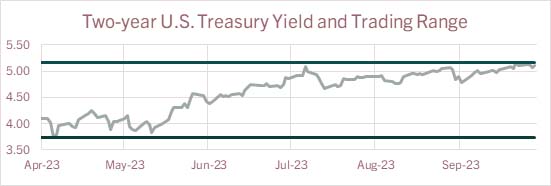
The two-year U.S. Treasury yield since April 1 has been pushed higher as shorter-term yields tend to be sensitive to expected monetary policy action (or inaction). The spread between the 2-year and 10-year Treasury yield has compressed to 48 basis points from 108 basis points on July 3. The Fed’s rapid increase in front-end rates is the primary driver of the yield curve inversion. However, as longer-term yields moved higher in recent weeks the yield curve is becoming less inverted. Look for the curve to normalize on signs policymakers are considering a policy shift. 
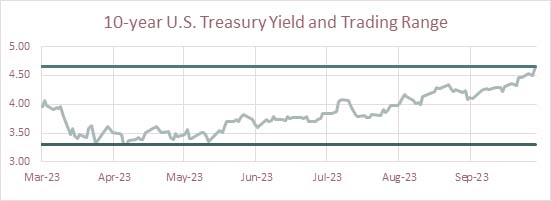
The six-month trading range for the 10-year Treasury yield is 3.30% to 4.65%. The 10-year Treasury yield may continue pressuring the trading range higher until there are signs inflation is slowing, employment is weakening and economic growth is slowing. Market forces are more impactful than Fed policy for long-term treasuries. While it is widely expected these rates will move in line with future economic expectations, longer-term yields may also remain at higher levels as the market contends with a $1.5 trillion federal budget deficit, $10 trillion in U.S. Treasuries maturing over the next one to two years and $95 billion in monthly quantitative tightening by the Fed.  |
Economic highlights
| Employment |
Nonfarm payroll expanded by 187k for August, which exceeded payrolls for both June and July. Education and health services hiring led the gains with 102K new jobs while leisure and hospitality added another 40k. Despite continued gains in payrolls, the unemployment rate increased to 3.8% as the labor force expanded by 736k while employment gained 222k resulting in more unemployed persons. The labor force participation rate rose 0.2 percentage points to 62.8%. The broader measure of unemployment that encompasses discouraged workers and those holding part-time jobs for economic reasons edged higher to 7.1%. Average hourly earnings increased to $33.82 in August, representing a 4.3% year-over-year increase in nominal terms. Adjusting for inflation, so-called real average hourly earnings increased 0.5% compared to a year ago. Leading indicators suggest the labor market remains tight with initial claims for jobless benefits at a nine-month low while continuing weekly claims are trending lower. Jobless claims may be pushed higher depending on how long auto workers remain on strike. Striking workers are not eligible for jobless benefits but layoffs resulting from the work stoppage would qualify. Overall, the continued resilience of the labor market provides the Fed support to maintain rates at higher levels until meaningful labor weakness is observed.

|
| Economic Growth |
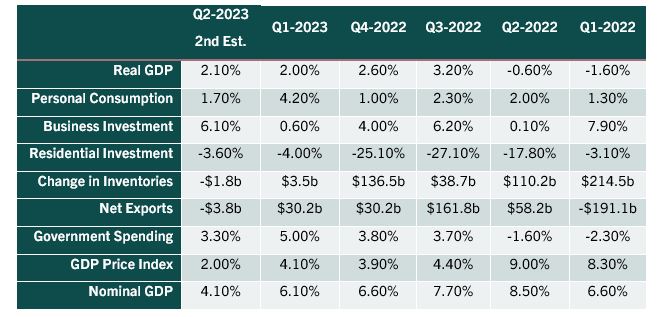
Gross Domestic Product: The second estimate for 2023 Q2 real GDP showed the U.S. economy expanded 2.1%, a slightly lower revision from the advance estimate. The accumulation of more complete data from the advance release indicated business spending was weaker while residential investment improved. Personal consumption continued to support overall economic growth while change in private inventories was a drag on growth. Overall, the downward revision to Q2 GDP does little to change the narrative for the current state of the economy as incoming data continues to show the U.S. economy is expanding at a sub-trend rate of growth. Estimates for Q3 GDP range from 2% to 4% on robust consumer spending supported by gains in wages.

|
| Consumer Inflation |
Consumer Price Index (CPI): Compared to the prior month, August consumer inflation was pushed higher primarily due to higher gasoline prices. Also contributing to the month-over-month increase were rising shelter costs (+0.3%) and food prices (+0.2%). Used auto prices fell 1.2% while new autos rose 0.3%. On an annual basis, consumer prices increased 3.7%, which is up from a recent low of 3.0% for June. Excluding food and energy, the core CPI rose 0.3% due to rising shelter and transportation services (+1.0%). Compared to a year ago, core CPI rose by 4.3%. The Fed’s preferred measure for inflation, the core PCE, increased by 4.2% year over year as of July.

|
| Monetary Policy |
The table below summarizes recent decisions regarding monetary policy action by the Federal Open Market Committee. The next FOMC meeting is October 31-November 1. Federal funds futures indicate a 26% chance for another 25-basis point rate increase at the November 1 meeting and a 40% probability for a rate hike at the December 13 meeting. 
|
The above commentary is a summary of select economic conditions prepared for AgWest Farm Credit management. It is being shared as a courtesy. As with any economic analysis, it is based upon assumptions, personal views and experiences of those who provided the source material as well as those who prepared this summary. These assumptions, conclusions and opinions may prove to be incomplete or incorrect. Economic conditions may also change at any time based on unforeseeable events. AgWest assumes no liability for the accuracy or completeness of the summary or of any of the source material upon which it is based. AgWest does not undertake any obligation to update or correct any statement it makes in the above summary. Any person reading this summary is responsible to do appropriate due diligence without reliance on AgWest. No commitment to lend, or provide any financial service, express or implied, is made by posting this information.

Crop insurance? Hail yes.
We can help guard your crop from the impact of unpredictable and extreme weather.
Learn more.jpg?sfvrsn=e8bfac6b_0)