Quarterly Economic Update: July 2024
Executive summary
Economic growth will likely continue at a modest pace despite financial headwinds, political uncertainty, persistently tight monetary policy, fading fiscal tailwinds and the accumulated impact of high consumer inflation over the last four years. Federal deficits, weakness in the commercial real estate sector, elevated geopolitical risk and weak global growth are also concerns.
For the remainder of 2024, look for hourly earnings and wages to expand by 3.5% to 4%, inflation to be near 3% and unemployment to remain slightly above 4%, which support personal consumption, business spending and Gross Domestic Product (GDP) growth of 1% to 2% (annualized). The first half of 2025 will likely see GDP growing by a similar rate of 1.5% to 2% (annualized), the Consumer Price Index (CPI) dropping below 3%, weakening job growth and unemployment around 4% to 4.5%. Signs of slower inflation and weaker job growth should allow the Federal Reserve to start easing policy rates towards the end of the year or early 2025 with two to four 25 basis point rate cuts throughout 2025.
The economy expands at a modest pace with a reduced probability of recession.
The pace of economic growth for Q1 2024 slowed to 1.4%. During this period, consumer spending grew by 1.5% with contributions from business spending and the housing sector. Government spending slowed and inventories and net exports were an outright drag on growth. The Federal Reserve (Fed) forecasts real GDP will expand by 2.1% in 2024 and hold steady at 2.0% for 2025 and 2026. The impact of persistently elevated interest rates continues to affect areas of the economy differently.
- Home buyers are struggling with 7% or higher 30-year fixed mortgage rates. Housing starts are at the lowest level in four years, and year over year, existing home sales are down 2.8%, and home prices are up nearly 7%. Despite this weakness, the average price for previously owned homes continues to increase at an annual rate of nearly 6%.
- Higher interest rates, in addition to persistently elevated inflation and weakening job markets, may be leading to weaker consumer confidence. This may indicate a slowdown in spending. Consumer spending is the primary driver of economic growth in the U.S.
The unemployment rate has trended higher as the labor force grows faster than household employment, largely due to immigration flows and demographic trends. A sharp increase in unemployment to the 5% to 6% range would likely indicate the economy is in or nearing a recession. The average unemployment rate has been 5.7% since the late 1980s.
Monetary policy could start easing by Q4 or early 2025.
Many analysts expect the Fed to start easing monetary policy within the next six months, provided inflation pressures start subsiding and employment growth cools.
- Recent federal funds futures and policymaker guidance suggest cuts totaling 50 basis points for this year from the current target rate of 5.25% to 5.50%, with the first 25 basis point rate cut occurring at the September FOMC meeting. Policymakers may wait for concrete signs of progress on inflation toward the Fed’s 2% target for core-PCE (personal consumption expenditures minus food and energy). Core-PCE is currently at 2.75% and forecasted to decline to 2.3% by year end 2025.
- The FOMC trimmed the pace of Quantitative Tightening (the process of reducing bond holdings) to sustain market liquidity by 37% to $60 billion per month during their meeting in May. Federal Reserve balance sheet holdings of Treasury and agency mortgage-backed assets are currently valued at $6.8 trillion, down 11.5% year over year.
- The Long-term Rate Projection increased from 2.5% to 2.75% for June 2024, which was unchanged from June 2019 to December 2023. Market analysts are unsure about what this signifies. For instance, it could mean officials think the 2.0% core-PCE target is too low or the spread between the 2.0% target and the policy rate should be wider (more restrictive).
Equity markets are resilient, but the pace of growth is a concern.
Equity markets have performed better than expected given persistently elevated interest rates, largely due to a small selection of high-tech stocks. The S&P-500 index is up over 26% from a year ago and nearly 15% year to date. Some investors are concerned that growth is too narrowly concentrated and/or major equity indexes have risen too fast.
Some consumers are financially stressed.
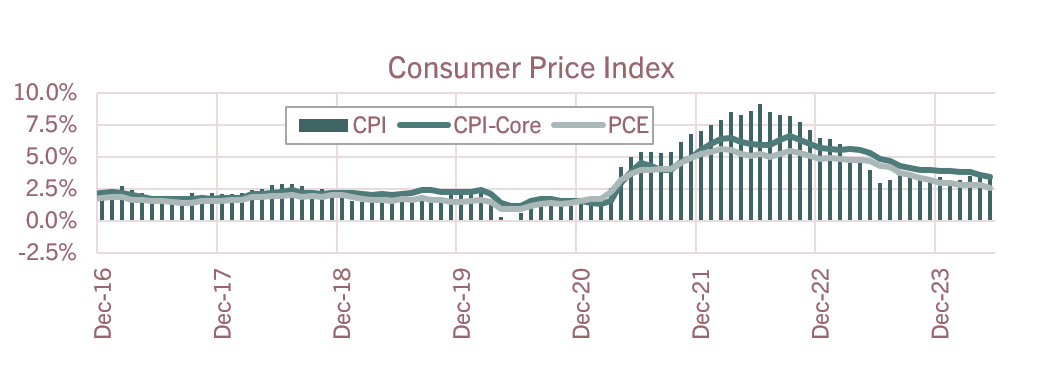
Consumer loan delinquencies have increased every quarter since Q3 2021, though they remain below the 20-year and 30-year averages. This trend reflects growing financial stress among consumers (particularly among those who earn less than $50,000 per year) and may be due in part to the cumulated impact of high inflation over the last four years. Wages have not kept up with the increase in consumer prices, as the total CPI index has increased over 22% while average hourly earnings are up 17.5%.
Fiscal policy is an increasing concern.
The current pace of federal spending adds about $1 trillion to the national debt every 100 days, which now equates to over 122% of GDP. The supply of treasury bonds is growing and may eventually put upward pressure on interest rates, tax rates and/or inflation. While most agree the growth in debt is unsustainable, Congress is unlikely to respond until a crisis arises or it creates significant hardship on the American people.
Commercial real estate worries persist.
Concern over the deterioration of commercial real estate (CRE) values is a worry for some regional banks, namely New York Community Bank. It is too early to determine if weakness in CRE will spread to other investment classes, but it bears watching.
Global conditions present risk to outlook.
Conflicts in the Middle East and Ukraine continue to disrupt global trade flows and dampen economic growth. Shipping companies are adapting to longer trade routes as major throughputs in the Red Sea and Panama Canal remain limited and major ports experience delays and/or disruptions. There is increasing evidence that China’s economy is weakening, which may lower demand for raw materials while also increasing demand for physical assets such as gold. Rising gold demand and prices could impact financial and stock markets in the U.S.
Interest rates review
| U.S. Treasury Yields | The six-month trading range for the 2-year Treasury has been stable at 4.18% to 5.03% as the Fed remains on hold (short-term yields are driven by monetary policy). From the March Market Commentary, the top of the range moved lower to 5.03% from 5.22% while the bottom of the range was unchanged at 4.18%. Many market observers believe policymakers have done enough to bring inflation under control and the federal funds rate has reached its terminal rate for this Fed tightening cycle. The market is projecting the Fed will cut rates by a total of 50 basis points this year with the first and second rate cuts occurring at the September and December FOMC meetings. Looking ahead to 2025, futures suggest we can expect 25 basis point rate cuts at the January, April and July FOMC meetings as well. This amounts to a total of 125 basis points in cuts over the next year. The Fed’s economic projections from the June policy statement indicate one rate cut this year with the potential for 100 basis points in rate cuts in 2025. Recent speeches from officials suggest the December FOMC meeting is when a rate cut may be announced. 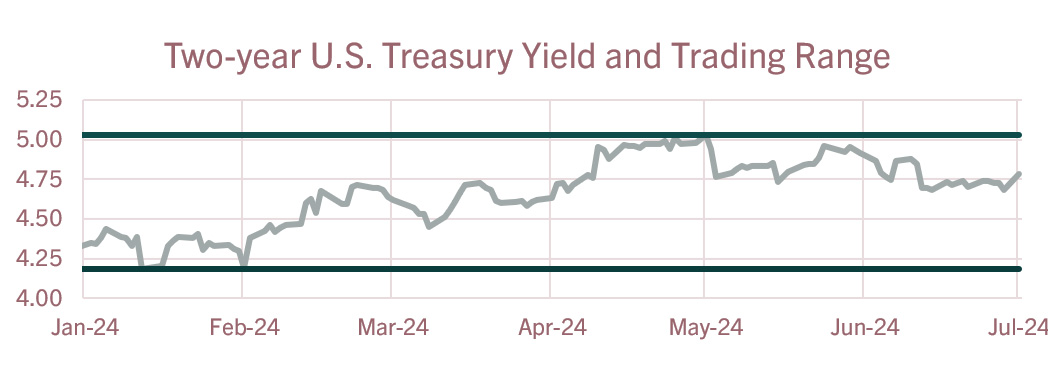
The trading range for the 10-year Treasury yield narrowed to between 3.83% and 4.72% (the top end came down from 4.97%). Outlooks for economic growth and inflation typically drive yields for 10-year treasuries. The runup in yields in April was related to a string of stronger-than-expected economic reports and record highs for the major equity indexes, which caused the Fed to indicate potential rate cuts would likely be delayed. Federal Reserve Chair Jerome Powell said it would likely take “longer than expected” for the FOMC to gain confidence that inflation is on a sustainable path toward the Fed’s target of 2%. The slope of the yield curve remains inverted as there is uncertainty over when the first cut in policy rates may occur. The 10-year yield has been lower than the 2-year yield since July 5, 2022, and the 3-month Treasury Bill yield since November 8, 2022, which is the longest inversion on record. Yield curve inversions are the result of the Fed increasing monetary policy rates to a level that exceeds long-term yields. Typically, policy rates are increased in response to a perceived imbalance in the economy by the Fed (i.e. excessive demand). As banks lend long and borrow short (deposits) profit margins are squeezed and credit contracts. A recession has been slow to develop during the current cycle as banks have kept the rate paid on savings accounts very low while the increase in short-term interest rates has not been as challenging as compared to past tightening cycles. The commercial bank prime lending rate has increased to 8.5%. While bank lending has slowed somewhat, it hasn’t been widespread enough to cause a recession. 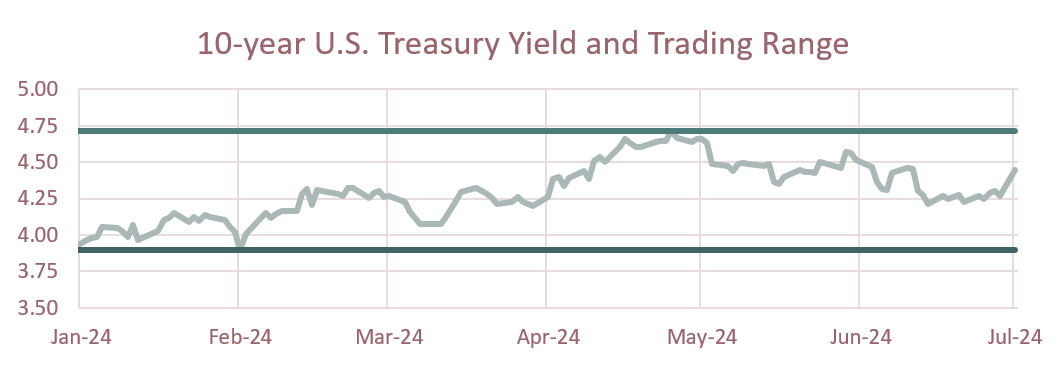 |
Economic highlights
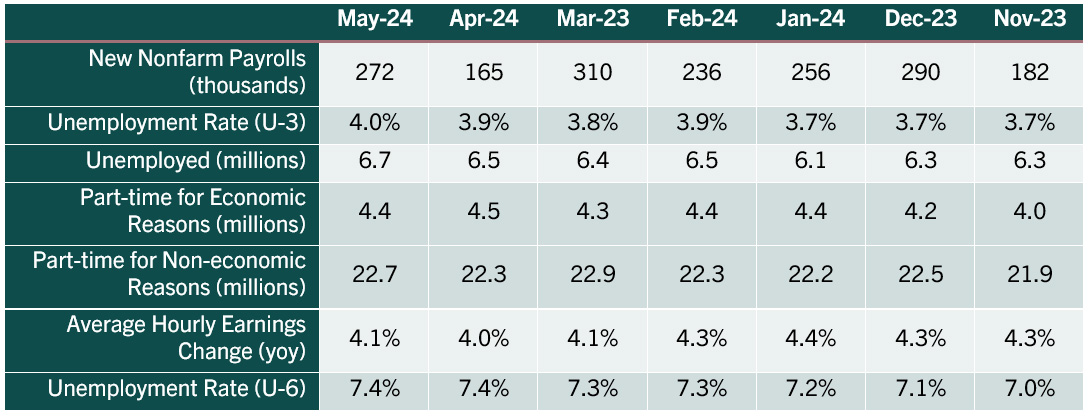
| Employment | The Establishment Survey from the U.S. Bureau of Labor Statistics reported nonfarm payrolls surged by 272,000 for May, which exceeded market expectations. The new jobs level remains sufficient to support the current rate of unemployment. The labor sector has been much more resilient than economists expected given 525 basis points in monetary tightening. Nonfarm payrolls have exceeded 125,000 for 41 consecutive months ranging from 939,000, as we were emerging from the pandemic lockdowns in July 2021, to 136,000 in December 2022. Education and health services, government employment, and leisure and hospitality sectors continue to lead job growth. The Household Survey indicated the unemployment rate for May rose 0.1 percentage points to 4.0%, the highest it has been since November 2021. The increase in unemployment was the result of a 408,000 decline in employment while the labor force shrank by a smaller 250,000 resulting in 157,000 more unemployed. Compared to a year ago, the labor force has grown by 909,000 while the number of employed has increased 376,000, resulting in 533,000 more Americans being unemployed. The labor force participation rate, which includes those working or actively looking, decreased 0.2 percentage points to 62.5%. The broader measure of unemployment that encompasses discouraged workers and those holding part-time jobs for economic reasons was unchanged at 7.4%. Average hourly earnings increased 0.4%, or 14 cents to $34.91, which is up from $33.54 a year ago, representing a 4.1% year-over-year increase in nominal terms. Adjusting for inflation, so-called real average hourly earnings increased 0.8% compared to a year ago. Leading indicators suggest the labor market has softened somewhat but remains relatively stable as the four-week average for initial claims for jobless benefits has increased to 232,750 from 214,500 in early May. While job openings declined in April to 8.1 million, which is down from 9.9 million a year ago, openings are well above the 5-year average of 6.1 million from April 2014 to April 2019, just prior to the COVID-19 outbreak. Additionally, job openings continue to exceed the number of unemployed by nearly 1.6 million. Despite modest weakness, the continued resilience of the labor market may contribute to the Fed maintaining policy rates at higher levels.
|
| Economic Growth | Gross Domestic Product: (GDP) The most recent estimate for Q1 2024 real GDP (inflation adjusted) showed the U.S. economy expanded by 1.4%, a slight upward revision from the second estimate of 1.3%. The accumulation of more complete data from prior updates showed consumer spending was losing momentum coming into quarter end. Recent weaker retail sales reports reflected the slowing trend for consumer spending. Upward revisions to business and government spending were offset by weakness in inventory investment and net exports. Looking ahead to the Q2 2024 growth, forecasters are projecting the economy expanded by about 2%. We will get the advance report on Q2 2024 GDP on July 25. 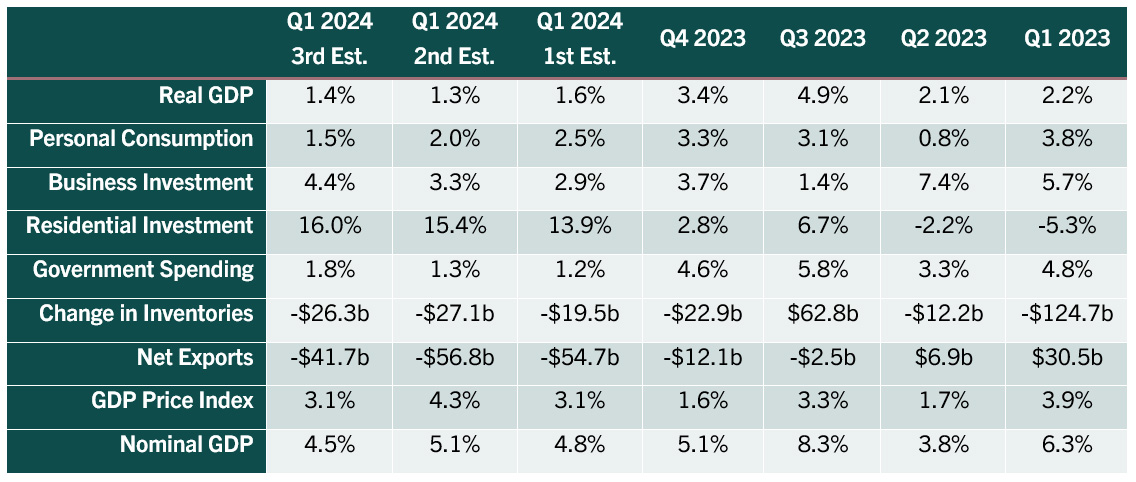 |
| Consumer Inflation | Consumer Price Index (CPI): Despite consumer inflation slowing from the June 2022 peak, it remains elevated with year-over-year U.S. inflation at 3.3% for May 2024. CPI inflation has remained above the low of 3% from nearly a year ago. Shelter prices, which account for about a third of overall CPI, are running at 5.7%. A deeper look into the data indicates food prices are up 2.1% year over year while gas prices are up 2.2%. Stripping out volatile food and energy prices, the so-called core rate of inflation is increasing at 3.4%, which is largely being held higher by services-based inflation (+5.3%) while commodity-based price inflation is actually falling at -1.7% compared to a year ago. This is largely due to decreases in used car and truck prices. The Fed’s preferred measure for inflation, the core PCE (Personal Consumption Expenditure), increased by 2.6% year over year as of May. The Fed’s target for core PCE is 2.0%.
|
| Monetary Policy | The table below summarizes recent monetary policy actions by the Federal Open Market Committee. The next FOMC meeting is scheduled for July 30-31. Federal funds futures suggest policymakers will trim rates by 25 basis points in September and December. In their June Summary of Economic Projections statement, Federal Reserve officials indicated they believe one 25 basis point cut in rates would be appropriate. This would likely occur at the November or December FOMC meeting. At the May FOMC meeting, the Committee reduced quantitative tightening by decreasing the runoff of Treasury security holdings from $60 billion per month to $25 billion. This will slow the runoff of Treasury securities from the Fed’s portfolio and help support liquidity for the U.S. Treasury bond market. Directives to the open market desk at the Federal Reserve Bank of New York
|
The above commentary is a summary of select economic conditions prepared for AgWest Farm Credit management. It is being shared as a courtesy. As with any economic analysis, it is based upon assumptions, personal views and experiences of those who provided the source material as well as those who prepared this summary. These assumptions, conclusions and opinions may prove to be incomplete or incorrect. Economic conditions may also change at any time based on unforeseeable events. AgWest assumes no liability for the accuracy or completeness of the summary or of any of the source material upon which it is based. AgWest does not undertake any obligation to update or correct any statement it makes in the above summary. Any person reading this summary is responsible to do appropriate due diligence without reliance on AgWest. No commitment to lend, or provide any financial service, express or implied, is made by posting this information.
Return to Industry Insights home page
IN THIS SECTION
![]()
.jpg?sfvrsn=68087301_1)
Economic headlines, data and trends
Monthly economic trends, data and major industry headlines.
Learn more