Quarterly Economic Update: April 2025
Executive summary
The U.S. economic landscape in April 2025 is characterized by resilience and growth, driven by consumer and government spending. Despite recent equity market corrections, consumer behavior remains strong, supported by low unemployment and rising wages. The Trump Administration's efforts to reduce regulations and implement tariffs aim to improve business conditions, although these initiatives add uncertainty to the economic outlook. The Federal Reserve (Fed) maintains a steady monetary policy, forecasting interest rate adjustments and ongoing quantitative tightening. Various risks, including geopolitical conflicts, rising consumer debt, and potential weakening of the U.S. dollar, pose challenges to the economy. Inflation is projected to remain above the Fed target, influenced by housing and labor costs.
Economic drivers
Government and consumer spending drives economic growth.
In 2024, the U.S. economy proved much more resilient than forecasters expected. Real Gross Domestic Product (GDP) expanded by 2.8%, which nearly matched the growth rate of 2.9% for 2023. Consumer spending and government spending fueled much of the growth, expanding by 2.8% and 3.4%, respectively. Consumer spending accounts for nearly 70% of GDP while government spending is around 17% (6.5% for federal and 10.5% for state and local).
For 2025, moderately low unemployment and rising wages should enable consumer spending to drive GDP growth despite inflation concerns. The Trump Administration’s efforts to reduce government spending may prove a counterbalance, though its impact may be limited given the smaller role federal spending has in the economy. Recent policy initiatives on foreign trade and tariffs, fiscal policy, regulation and enforcement of immigration laws have added uncertainty to the economic outlook raising investor caution and weakening consumer confidence. A sustained period of weaker confidence will weigh on consumer spending and GDP growth.
Government reforms may improve business environment.
The Trump Administration is working to improve business conditions by reducing regulations and applying tariffs. While the World Bank ranks the U.S. as sixth in its Ease of Doing Business Index, there are multiple subcomponents that rate poorly, including the ability to get electricity, start a business, register property and protect minority investors, among others. Lowering the regulatory burden may help to improve these factors. Many countries currently have more stringent trade barriers than the U.S. and many argue this leads to an unbalanced competitive environment. The Trump Administration is using tariffs to improve the competitiveness of U.S. businesses both at home and abroad as well as increase leverage in trade negotiations. Trump’s efforts will take time to implement as his initiatives work through the legislative process and judicial challenges.
Correction in equity markets may have downstream impacts.
The recent correction in equity markets may translate into reduced spending for a few quarters as the wealth effect (people are more willing consume goods and services when their net worth is higher) we’ve seen for the past two years loses momentum: the top 10% of earners in the U.S. account for nearly half of all consumer spending. However, a typical byproduct of equity market corrections is lower U.S. Treasury yields as investors and traders seek the safety of government securities versus the volatility of equity prices. Treasury yields have fallen significantly since mid-January. If the correction deepens, yields could continue trending lower and at some point provide a boost to the housing market due to falling mortgage rates. The 30-year fixed mortgage rate is down 70 basis points from mid-January to 6.7%.
Federal Reserve holds monetary policy steady.
The Federal Open Market Committee (FOMC) has held rates unchanged for the first two policy meetings of the year. Officials forecast the federal funds target range will finish the year at 3.75-4.0%, which equates to two 25 basis point rate decreases from the current target range of 4.25-4.5%. Federal funds futures are very reactive to market conditions and the equity market turmoil. Futures now indicate the market is looking for four 25 basis point rate cuts, currently slated for June, July, September and December. As futures respond to changing market conditions and developments, the number and timing of rate cuts are fluid.
The most recent policy statement indicated policymakers believe economic activity has been expanding at a solid pace and labor market conditions are firm. However, inflation remains above their 2% target and officials see more risk to the outlook and ability to achieve their inflation and employment goals.
The FOMC announced a change in the pace of quantitative tightening beginning in April. The Fed will continue reducing its holdings of Treasury securities, but at a slower pace of $5 billion per month versus the current level of $25 billion. Monthly redemptions of agency debt and agency mortgage-backed securities will continue at the current rate of $35 billion per month.
Fed officials recently updated their forecast for the economy and monetary policy for 2025-2027. There were modest updates to the projections which reflected increased uncertainty around their economic outlook. The forecast was revised to show slightly weaker real GDP and an uptick in unemployment and inflation. There were no changes to projections for policy rates (federal funds rate).
Federal reserve projections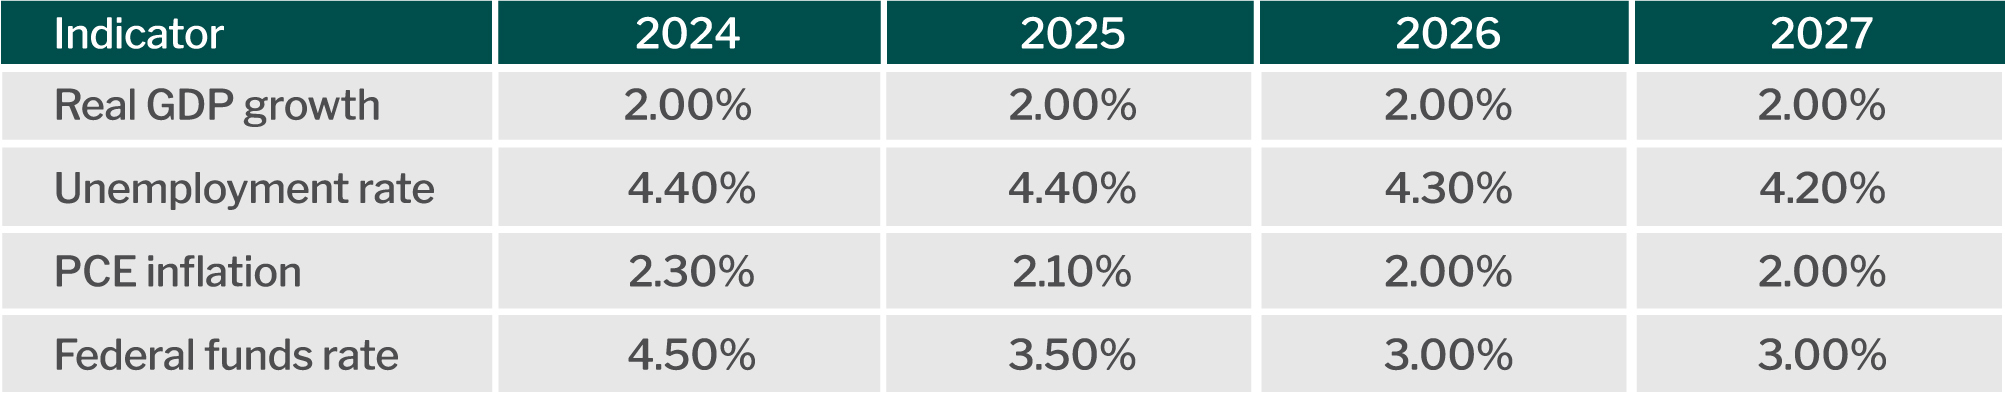
Source: Federal Reserve Board.
Risks to the economy
The following present risks to the economic outlook:
- The implementation of President Trump’s policies is disjointed, and the Administration could begin losing the support of Congress and the American people.
- The application of tariffs disrupts international trade and supply chains.
- Rising federal debt levels have the potential to increase inflation and treasury yields, weaken the U.S. dollar and reduce the capacity of the U.S. government to respond to an economic crisis and war. The debt to GDP ratio is now at about 124% and continuing to grow. Sustained growth in debt will eventually lead to crisis and hardship for the American people. Congress is unlikely to respond until a crisis arises or it creates significant hardship on the American people.
- Rising prices and debt loads are leading to financial stress, particularly among low wage earners. Coupled with a weaker equity market and deterioration in the wealth effect, and this may eventually slow consumer spending. Delinquencies for consumer credit cards and auto loans are trending higher.
- Conflicts in the Middle East and Ukraine are disrupting global trade flows and dampening economic growth. An escalation of either would worsen conditions, however, President Trump appears committed to ending both wars.
Economic data and trends
Interest rates
U.S. Treasury yields have been in a downward trend since President Trump was inaugurated in mid-January. The 2-year yield is down about 50 basis points to 3.85% while the 10-year yield is off about 65 basis points to 4.15%. During this same time the 30-year fixed mortgage rate is down nearly 60 basis points to 6.75%. Rates have moved lower on elevated concern that the economy will expand at a slower rate. However, further rate declines may be a challenge as inflation is expected to hover near current levels for a period. Given this backdrop, look for yields to gradually trend lower over the next 6-12 months. Short-term yields will likely respond to expected monetary policy while longer term yields will move with the outlook for inflation and growth. The primary driver of these factors is President Trump’s ability to reform government and the effectiveness of the Administration to execute on trade policy.
Treasury yields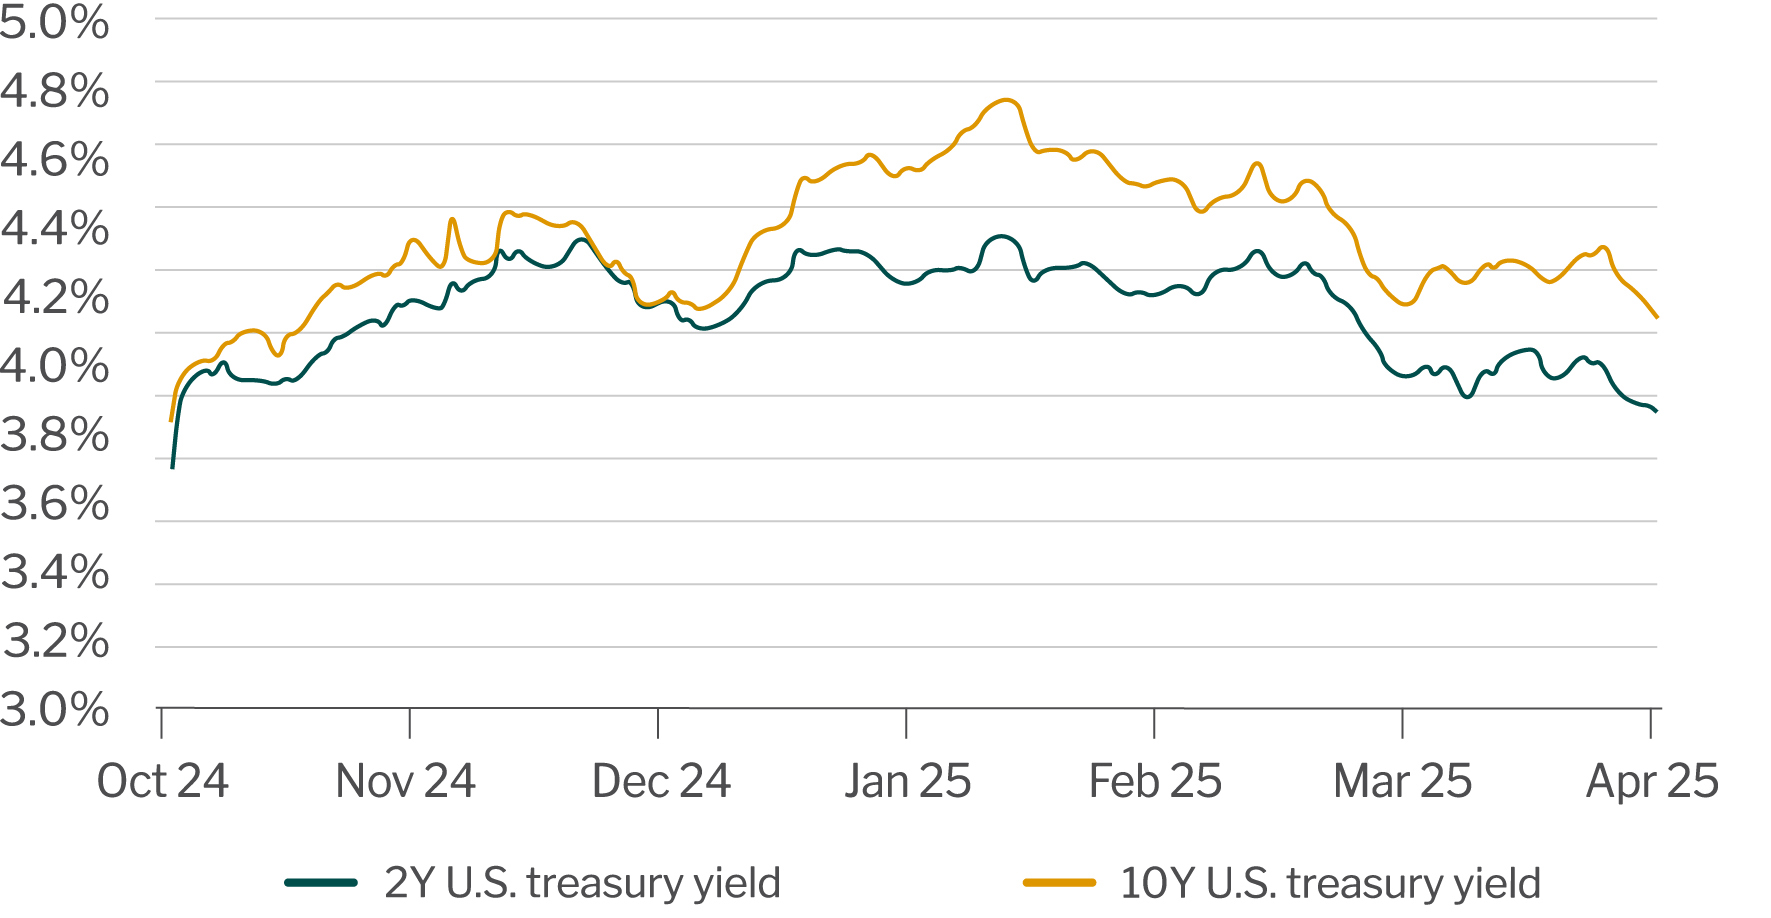
Source: U.S. Department of Treasury.
Employment
Nonfarm payrolls for February rose 151,000, which fell short of expectations. Revisions to the prior two months added a combined 2,000 jobs. The unemployment rate rose by 0.1 percentage points to 4.1% as the decrease in employment exceeded the decline in the labor force. The report also indicated a net reduction of 10,000 federal government jobs, which was likely due to President Trump’s hiring freeze. (The normal turnover is about 30,000 Federal employees per month.) Payrolls have increased an average 200,000 per month for the past three months and 162,000 for the past 12-months. Meanwhile, average hourly earnings rose 0.3% for February and 4.0% over the past year. The U-6 unemployment rate, a broader measure that includes marginally attached and discouraged workers, unexpectedly increased 0.5 percentage points to 8.0%.
Weekly jobless claims data confirms the Fed’s view that labor market conditions remain firm and should continue for the near-term. Weekly initial claims for jobless benefits have averaged 225,000 for the past 12-months. An increase to 300,000 to 350,000 in weekly claims would signal material weakness in employment with rising unemployment and the possible onset of a recession.
Jobs, unemployment and hourly earnings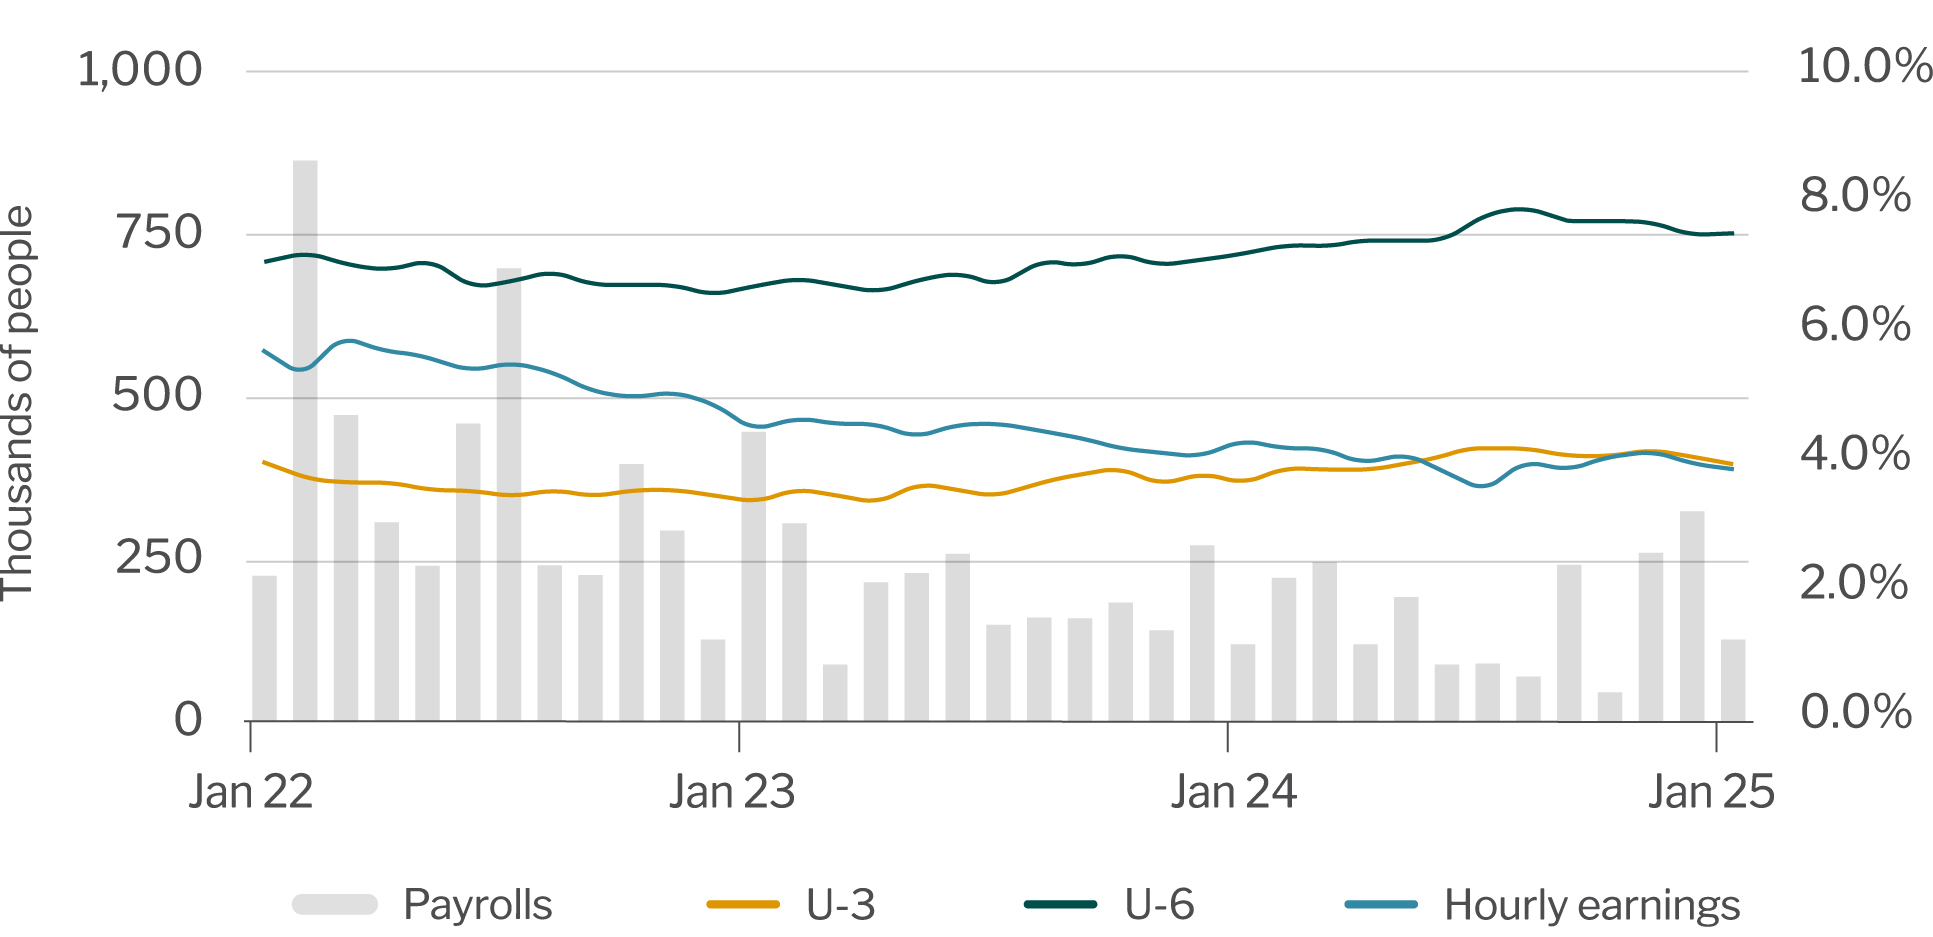
Source: U.S. Bureau of Labor Statistics.
Gross Domestic Product
The third estimate for real growth in Q4 2024 indicated GDP expanded by 2.4% which was weaker than Q3 2024 GDP growth of 3.1%. Consumer spending and expansion in housing investment for the fourth quarter was stronger than the third quarter, but weakness in business and government spending pulled the overall growth rate lower. Increases in the price indexes were also a drag on real growth.
Uncertainty related to the Trump Administration policies on trade is likely pulling forward imports for manufacturers and producers as they attempt to beat the implementation of tariffs. This will result in a larger Q1 net exports number on a sharp increase in imports, which will drag overall GDP lower. However, growth for the second and third quarters is expected to accelerate as net exports data is more positive.
Provided wage growth continues, consumer spending maintains moderate momentum and unemployment is modest, economic growth during the second half of the year could be closer to the 2.0-2.5% range. Watch retails sales reports, initial jobless claims data, confidence surveys and energy prices for indicators of economic activity. It will take time for the tariffs to be fully implemented so benefits of trade policy will take longer to impact economic growth. The initial impact is expected to add upward pressure on products where there are no substitutes for the imported item(s). Housing activity will be influenced by mortgage rates.
Forecasts for Q1 and Q2 GDP growth vary greatly. The Federal Open Market Committee (FOMC) members and staff expect GDP to expand by an average of 1.7% for 2025. The New York Fed is projecting Q1 growth of 2.8% and Q2 growth of 2.6%. Meanwhile, the Federal Reserve Bank of Atlanta forecasts Q1 2025 real GDP growth to contract by -1.4%.
Real Gross Domestic Product (GDP).jpg?sfvrsn=2a9a12be_1)
Source: U.S. Bureau of Labor Statistics.
Inflation
The CPI index for January rose by 0.5%, the largest month-over-month increase since January 2023. The increase was largely due to higher food and energy costs (gas prices rose 1.8%) while prices for used autos jumped 2.2%. During February, the rate of increase slowed as food prices rose by 0.2% and gas prices actually fell 1.1%. Used auto prices continued to increase, but at a slower pace of 0.9%.
The year-over-year consumer price inflation rate was 2.8% for February. Over the past twelve months the year-over-year consumer inflation rate has ranged between 2.5-3.5%. A history of various inflation measures is shown in the graph below. The bars reflect the year-over-year total CPI index. Other measures of inflation include the CPI Core rate, which looks at the inflation rate excluding food and energy prices, and the Core PCE (personal consumption expenditures) price index. Core PCE is the Fed’s preferred measure of inflation.
The primary drivers of inflation over the past few years have been housing costs and services costs. The rate of increase for both items is slowing and expected to remain in a gradual downward trend. While food and energy prices can be volatile, the impact on the total CPI indexes can be muted as food and energy make up about 14% and 6%, respectively, of the total index. Shelter prices comprise about 35% of the index.
If you divide the total CPI index by commodity-based and service-based categories, year-over-year commodity-based inflation for February was -0.1% while service-based inflation rose by 4.1%. A large component of services is labor costs. To slow the rate of service-based inflation, the rate of increase in hourly and weekly earnings will need to slow. From 2009-2018 average hourly earnings rose 2-3% annually. Starting in 2018 many states dramatically increased their minimum wage rates, which saw annual increases of about 6%. Since mid-2022 average hourly earnings have trended back down to 4%, which is where it’s been for most of 2024. Keep in mind, hourly earnings and wages have not gone down, just the rate of increase.
Core-CPI (CPI less food and energy) has decreased from a high of 6.6% in September 2022 to 3.1% for February. Meanwhile, the rate of core PCE has fallen from 5.65% in February 2022 to 2.8%. Federal Reserve policymakers would like the core PCE rate to decline to 2.0%, but elevated home prices, higher labor costs and tariffs may make it difficult for the economy to achieve the Fed’s target inflation rate for the near-term.
Consumer Price Index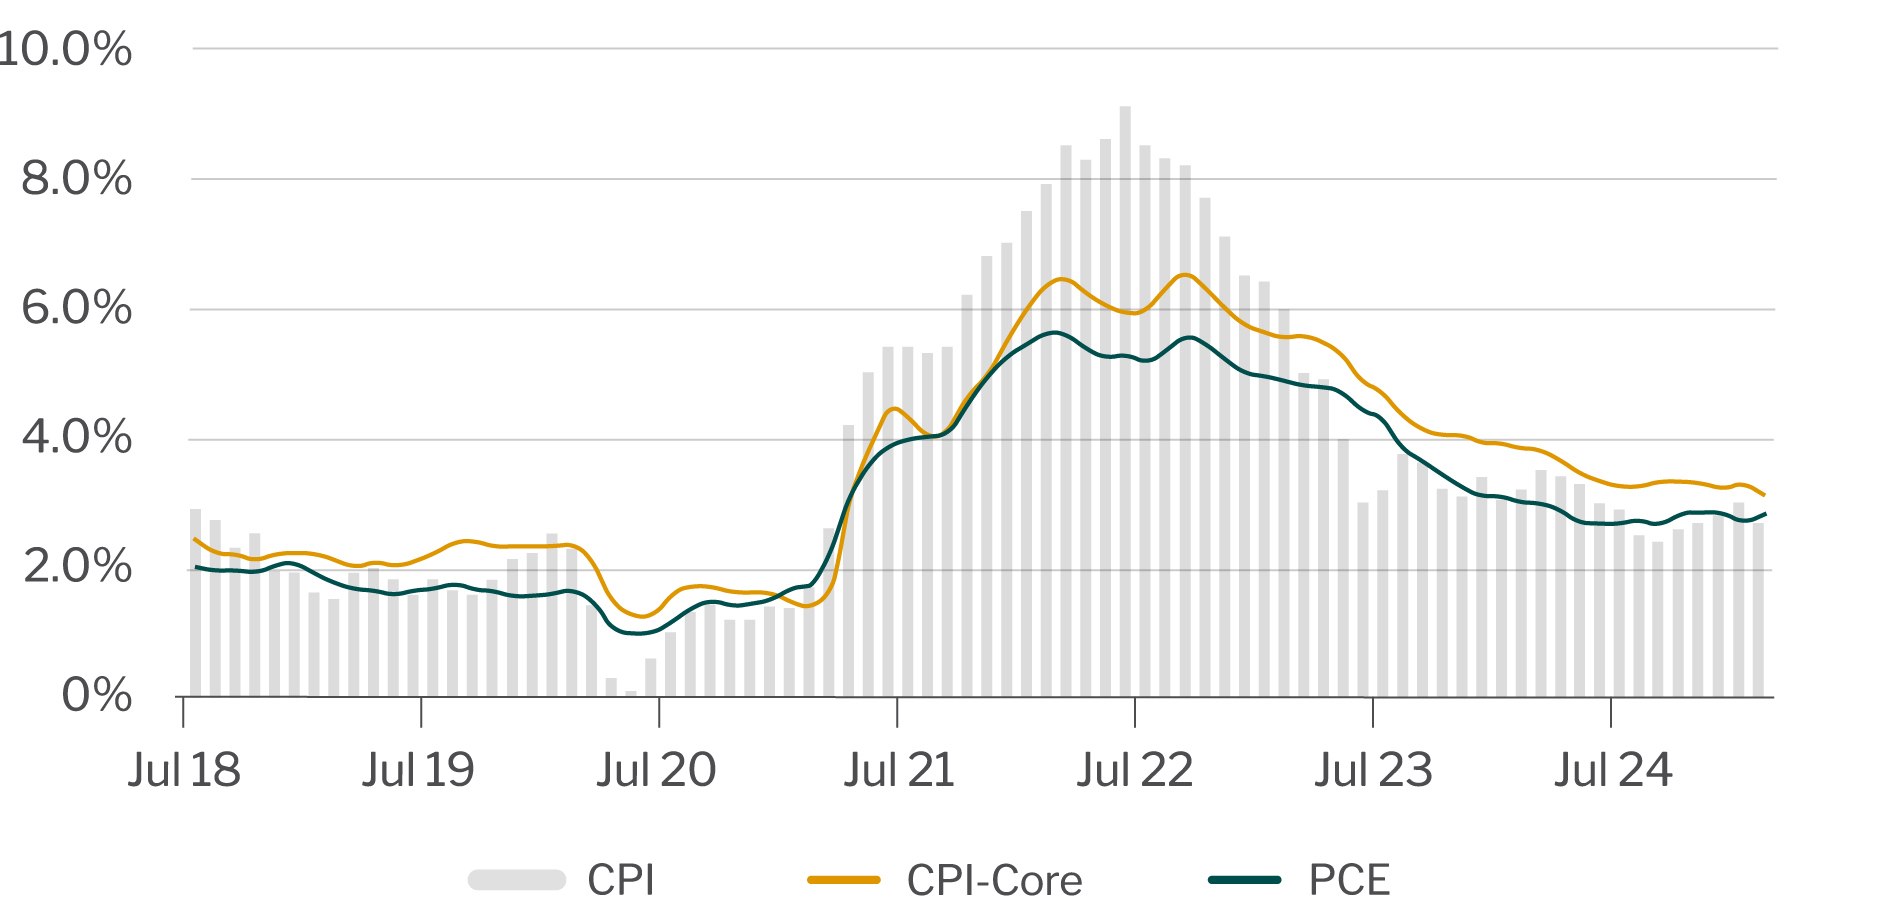
Source: U.S. Bureau of Labor Statistics. U.S. Bureau of Economic Analysis.
Return to Industry Insights home page
IN THIS SECTION
![]()
.jpg?sfvrsn=68087301_1 "My project-1 (26)")
Economic headlines, data and trends
Monthly economic trends, data and major industry headlines.
Learn more