March 31, 2024
Executive summary
The resiliency of the U.S. economy in 2023 has carried over into 2024, albeit at a more moderate pace. Current drivers include persistently elevated interest rates, easing of monetary policy expectations, resilient equity markets, financial stress among some consumers, rising federal deficits, commercial real estate risk, geopolitical risk and weak global growth. Overall, the economy is expected to continue growing at a modest pace, with inflation gradually trending lower and unemployment inching higher.
Economy grows, but elevated interest rates have an impact
The U.S. economy grew by 3.4% in Q4 2023, largely driven by consumer and government spending and business investments in inventories. The Federal Reserve (Fed) forecasts real Gross Domestic Product will slow to 2.1% in 2024, with unemployment finishing the year near 4.0%. Persistently elevated interest rates are impacting the economy across multiple levels:
- Home buyers are struggling with 7% or higher 30-year fixed mortgage rates.
- Consumers are less willing to take on debt loads.
- Businesses have slowed hiring in anticipation of lower consumer spending.
Monetary policy to start easing by mid-year
The Fed is expected to ease monetary policy within the next three to six months due to lower anticipated inflation levels, slower economic growth and weaker employment numbers.
- Recent federal funds futures and policymaker guidance suggest cuts totaling 75 basis points for this year from the current target rate of 5.25% to 5.50%, with the first 25 basis point rate cut occurring at the June Federal Open Market Committee (FOMC) meeting. Core-PCE (personal consumption expenditures minus food and energy) is forecast to trend lower from 2.8% to about 2.5%. Although higher than the Fed’s 2.0% target, continued slowing in the inflation rate should be sufficient to ease rates during the second half of the year.
- The Fed may slow the rate of Quantitative Tightening (the process of reducing bond holdings) to sustain market liquidity. An announcement could occur at the May or June FOMC meeting, with possible implementation a meeting or two later. Fed balance sheet holdings of Treasury and agency mortgage-backed assets are currently valued at $7.03 trillion, down 11% year over year.
FOMC reiterated it will consider a wide range of information, including readings on labor and inflation, and financial and international developments in setting policy measures.
Equity markets are resilient, but concerns persist
Equity markets have tolerated higher interest rates better than expected, largely supported by a small selection of high-tech stocks. The S&P-500 index is up 30% from a year ago and nearly 10% year to date. Some investors are concerned that growth is too narrowly concentrated and/or that major equity indexes have risen too fast.
Some consumers are financially stressed
Also of concern is the upward trend of consumer loan delinquencies, which have increased for eight consecutive quarters, but remain below the 20-year and 30-year averages. The upward trend in delinquencies is a sign of growing financial stress for consumers.
Fiscal policy is an increasing concern
The current pace of federal spending adds about $1 trillion to the federal debt every 100 days, which now equates to about 121% of GDP. The supply of Treasury bonds is growing and may eventually put upward pressure on interest rates, tax rates and/or inflation. While most agree the growth in debt is unsustainable, Congress is unlikely to respond until a crisis occurs or hardship on the American people increases.
Commercial real estate worries persist
Concern over the deterioration of commercial real estate values is a worry for some regional banks, namely New York Community Bank. It is too early to determine if weakness in CRE will spread to other investment classes, but it bears watching.
Global events present risk to outlook
Conflict in the Middle East and low water levels on the Panama Canal are raising energy and shipping costs (see Crop Inputs Snapshot for more information). Russia continues to advance militarily in Ukraine, leading some to worry about the long-term consequences for Europe and how trade patterns may evolve. Russia has strengthened relationships with large economies such as China and India and is working to create an alternative financial system that can facilitate trade outside of the U.S. dollar.
Global growth remains weak and may push foreign central bankers to respond
Global growth and inflation have weakened in most economies. However, central bank action around the globe appears to be a mixed bag with monetary policy decisions becoming less synchronized. Most central banks in developed economies appear to be on hold while messaging leans toward policy easing. A major announcement from the Bank of Japan indicated an end to their yield curve control framework and negative interest rate policy as the bank’s target of 2% sustained and stable inflation was in sight. For the Bank of England, recent data has allowed policymakers to back away from a tightening bias to being on hold. Expectations are that the BOE may start easing policy rates around August or September. Real GDP growth for the Eurozone is expected to be less than 1% while inflation runs at 2.5%. This will likely keep the European Central Bank on hold a while longer with a potential ease in policy rates sometime during Q3.
Interest rates review
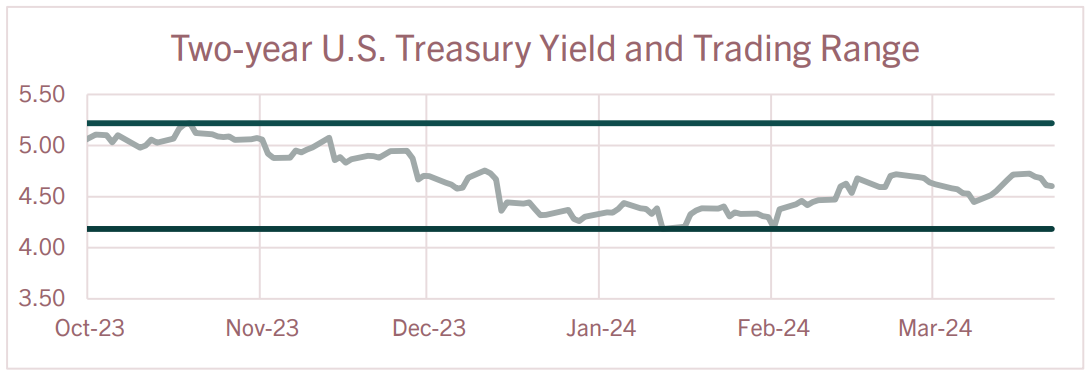
| U.S. Treasury Yields | The trading range for the 2-year Treasury yield has not changed for the past few months and remains at 4.18% to 5.22%. The 2-year yield started trending lower in November as data suggested monetary policymakers had done enough to bring inflation under control. And the federal funds rate had reached its terminal rate for this policy-tightening cycle. Expectations in November and December for five to six 25-basis point rate cuts in 2024 pushed 2-year yields lower but were a little too optimistic. Recent projections are calling for 75 basis points in rate cuts this year, likely starting in June or July. As short-term yields move lower, look for the yield curve to move to positive as the Fed begins executing a policy shift. 
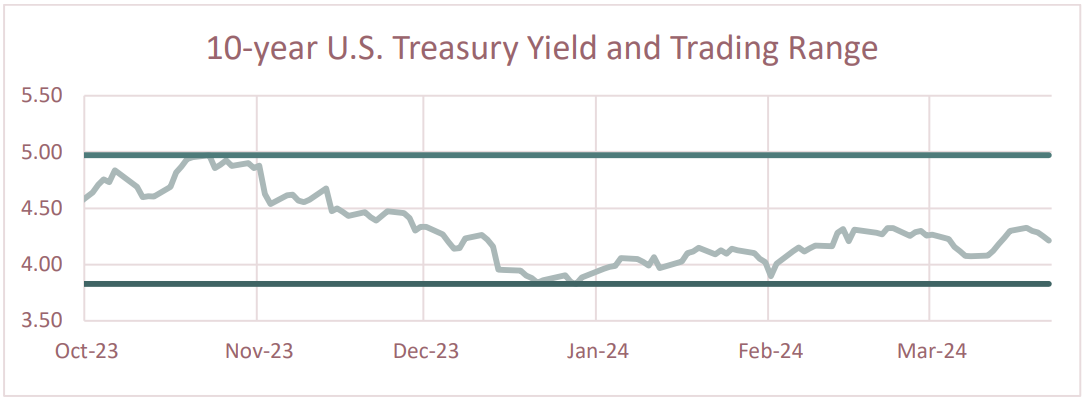
The trading range for the 10-year Treasury yield since October 1, 2023, is 3.83% to 4.97%. The runup in yields into October reflected the perception that inflation was going to be much more difficult to bring under control as the U.S. economy expanded by 4.9% during Q3 2023. The economy moderated in Q4 2023, slowing to 3.4% and the rate of inflation subsided. Expectations for even slower growth for Q1 2024 helped push long-term yields lower. But more recent economic data confirmed the resiliency of the U.S. economy and investors and traders updated their outlook for modest growth and gradual slowing in inflation. The slope of the yield curve remains inverted as there is uncertainty over when the first cut in policy rates may occur.  |
Economic highlights
| Employment | Nonfarm payrolls expanded by 275,000 for February, which exceeded market expectations. The new jobs level is sufficient to support the current rate of unemployment. The labor sector has been much more resilient than economists expected given 525 basis points in monetary tightening. Growth in nonfarm payrolls has been choppy over the past 12 months with monthly gains ranging from 150,000 to 303,000 while the average is 233,000. Education and health services, government employment, and leisure and hospitality sectors continue to lead job growth. The Household Survey indicated the unemployment rate for February rose 0.2 percentage points to 3.9% as increases in employment did not keep pace with the growth in the labor force. The labor force participation rate, which includes those working or actively looking, was unchanged at 62.5% for the third consecutive month. The broader measure of unemployment that encompasses discouraged workers and those holding part-time jobs for economic reasons rose 0.1 percentage points to 7.3%. Average hourly earnings increased to $34.57 from $33.15 a year ago, representing a 4.3% year-over-year increase in nominal terms. Adjusting for inflation, so-called “real average hourly earnings” increased 1.1% compared to a year ago. Leading indicators suggest the labor market has softened somewhat but remains relatively stable as the four-week average for initial jobless benefits claims has ranged between 200,750 and 253,500 for the past year. Furthermore, job openings declined in January to 8.86 million, which is down from 10.425 million a year ago. Despite modest weakness, the continued resilience of the labor market may contribute to the Fed maintaining policy rates at higher levels.
|
| Economic Growth | Gross Domestic Product: (GDP) The most recent estimate for Q4 2023 real GDP (inflation adjusted) showed the U.S. economy expanded by 3.4%, a slight upward revision from the second estimate of 3.2%. The accumulation of more complete data from prior updates showed consumer spending gained some momentum into quarter end. Upward revisions to consumer, business and government spending were offset by weakness in inventory investment and net exports. Looking ahead to the Q1 2024 growth, forecasters are projecting the economy expanded by about 2%.  |
| Consumer Inflation | Consumer Price Index (CPI): Despite consumer inflation slowing from the June 2022 peak, it remains elevated with year-over-year U.S. inflation at 3.2% for February 2024. Shelter prices, which account for about a third of overall CPI, are running at 6.0%. A deeper look into the data indicates food prices were up 2.2% year over year while gas prices were down 3.9%. Stripping out food and energy, the so-called “core rate of inflation” was 3.8%. This is largely being held higher by services-based inflation (+5.2%) while commodity-based inflation is nearly unchanged at -0.3% compared to a year ago. The Fed’s preferred measure for inflation, the core PCE (Personal Consumption Expenditure), increased by 2.8% year over year as of January. The Fed’s target for core PCE is 2.0%.
|
| Monetary Policy | The table below summarizes recent decisions regarding monetary policy action by the Federal Open Market Committee. The next FOMC meeting is April 30 to May 1. Federal funds futures suggest a potential for 75 basis points in monetary easing this year, which aligns with projections by Federal Reserve officials. The first-rate cut may occur at the June or July FOMC meeting.
|
The above commentary is a summary of select economic conditions prepared for AgWest Farm Credit management. It is being shared as a courtesy. As with any economic analysis, it is based upon assumptions, personal views and experiences of those who provided the source material as well as those who prepared this summary. These assumptions, conclusions and opinions may prove to be incomplete or incorrect. Economic conditions may also change at any time based on unforeseeable events. AgWest assumes no liability for the accuracy or completeness of the summary or of any of the source material upon which it is based. AgWest does not undertake any obligation to update or correct any statement it makes in the above summary. Any person reading this summary is responsible to do appropriate due diligence without reliance on AgWest. No commitment to lend, or provide any financial service, express or implied, is made by posting this information.


