Market summary
Markets are expecting the Federal Reserve to continue tightening monetary policy over the next few months. The Federal Open Market Committee is expected to slow the pace of rate hikes when it next meets Jan. 31-Feb. 1. Futures for federal funds indicate a 95% chance the Fed will increase the funds rate by 25-basis-points to a target range of 4.50-4.75%. Quantitative tightening will continue at a rate of about $95 billion per month.
With the rate of inflation at 6.5% on a year-over-year basis and unemployment at 3.5%, policymakers believe supply and demand imbalances are sufficient to threaten the Fed’s mandate of supporting stable prices and further tightening of monetary policy is appropriate.
Despite 425 basis points in monetary tightening by the Fed, the labor sector remains resilient while inflation levels are showing signs of slowing. Current data likely supports a terminal rate for fed funds of 5% or 5.25%, which implies 25-basis-point increases in February and March and potentially May. After central bankers believe rates are sufficiently restrictive look for the FOMC to keep rates high as policymakers believe reducing inflation will likely require “a sustained period of below-trend growth and some softening of labor market conditions” to slow the rate of inflation to the Fed’s 2% target. Based on this, forecasters believe the first rate cut may not occur until late-2023 or sometime in 2024. However, the path of policy rates could change if the economy were to start showing signs of significant deceleration or inflation remains persistently high.
Most economists believe a mild recession will occur sometime this year. Depending on how quickly inflation declines, the level of unemployment and the severity of the recession, the Fed may feel pressure to adjust course to avoid overtightening. If inflation lingers and unemployment remains sticky look for the Fed to keep rates higher for longer. The latest projections for 2023 from Fed officials forecast unemployment increases to 4.6% while real GDP expands by 0.5% with core PCE inflation at 3.5%. Furthermore, officials expect the funds rate will increase to 5.25% with rate cuts starting in 2024. Policymakers would view easing rates too soon and a resurgence in inflation as a worst case scenario.
The global growth outlook remains uncertain as foreign economies struggle with rising inflation. As central banks increase rates to slow demand the outlook for growth and employment weakens. The eurozone is contending with difficult challenges as extremely high natural gas prices caused by turmoil related to the Russian invasion of Ukraine and European energy policies pushed inflation higher. However, Europeans are getting some relief as unseasonably warm weather has eased demand for natural gas and home heating costs.
The European Central Bank is on a similar path as the Federal Reserve with more rate hikes expected as eurozone inflation remains unacceptably high. Look for more rate hikes with the Main Refinancing Operations rate expected to increase from the current 2.50% level to a potential terminal policy rate of 3.3%. Meanwhile, the Bank of England has tightened policy rates 340 basis points since December 2021 with the current BOE rate currently at 3.5%. More rate hikes are expected with futures suggesting a policy rate of 4.4% by mid-year.
Recent protests in China against the Chinese Communist Party zero-COVID policy resulted in a modest easing in restrictions. It now appears the unrest has caused the Chinese government to lift restrictions further. A gradual reopening in the Chinese economy may increase demand for raw materials resulting in a modest resurgence in shortages and supply chain pressures.
View on interest rates
The aggressive tightening by the Fed is stressing markets as measures of volatility remain elevated. Nevertheless, signs of persistent inflation and strong demand for labor will likely keep the Fed active as it is expected to continue raising policy rates for a few more months followed by a period of steady rates. Provided there is no significant change in the outlook for Fed policy, look for the current two-year and 10-year U.S. Treasury yield trading ranges to be steady for a few months. The trading ranges will be sensitive to economic conditions, shifts in monetary policy and geopolitical events.
Once the Fed indicates it is on hold the market narrative will likely shift to speculation on when rate cuts could start. Longer term U.S. Treasury yields would be expected to respond to weaker economic data and anticipate monetary easing resulting in a greater inversion in the yield curve until the Fed confirms it is considering rate cuts. We are likely nine-12 months away from a rate cut.
Interest rates review
| U.S. Treasury Yields | The two-year U.S. Treasury yield has risen to levels not seen since late 2007. The current yield remains near the top of the six-month trading range of 2.88%-4.73%. The current level of the two-year yield indicates the market is anticipating the Fed may slow pace of rate hikes. Shorter-term yields will remain sensitive to expected monetary policy action. The current spread between the two-year and 10-year Treasury yields is around -70 basis points as the curve has been inverted since July 5. 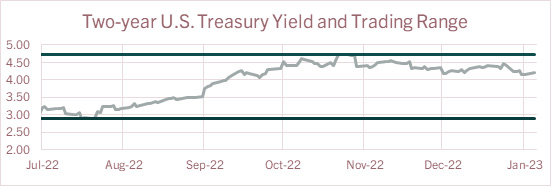 The six-month trading range for the 10-year Treasury yield is 2.56%-4.29%. While inflation remains high, some see rising recession risks. Look for less change in the range unless there are strong indications the Fed will become much more aggressive in its efforts to bring down inflation. On signs of much weaker growth, slowing inflation and rising unemployment, long-term yields would be expected to trend lower. 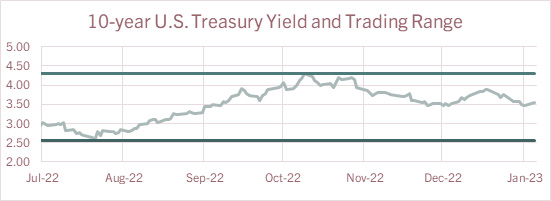 |
Economic highlights
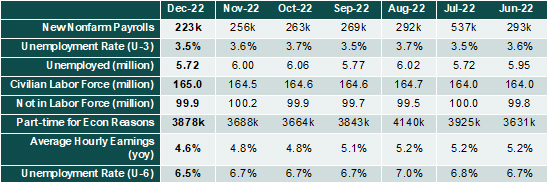
| Employment | The employment report from the Bureau of Labor Statistics comes from two surveys. The establishment survey reports data related to nonfarm payrolls and earnings. The household survey collects employment and labor force data and is the source for calculating the unemployment rate. Recently, the data has been mixed. The establishment survey reported nonfarm payroll gained in December, which was slightly stronger than expected, mostly offset by modest downward revisions to the prior two months. Household survey data indicated the number of unemployed fell 278k due to an increase in household employment of 717k and only a 439k increase in the labor force. The result was a 0.1 percentage point decline in the unemployment rate to 3.5%. Moreover, the labor force participation rate rose after stagnating much of the year. Average hourly earnings growth cooled modestly, up just 0.3% in December, annualizing at 4.1% in the final three months of 2022 versus 4.6% over the course of the year, suggesting a modest, slow deceleration in wage gains (a major focus for the Fed). Education and health services jobs led gains while construction jobs surprised to the upside, as nonresidential construction remained robust in the face of weak residential activity. Overall, this was another solid labor report that showed only a modest slowdown in the trend rate of job creation and wage gains. Notwithstanding, the unemployment rate is a lagging indicator, whereas the Weekly Jobless Claims report can be a leading indicator. Weekly Initial Jobless Claims have been under 250k since early August suggesting continued strong demand for labor. Typically, when jobless claims approach 300k and higher, this usually signals developing weakness for the labor sector. Additionally, the Job Openings and Labor Turnover Survey continue shows a declining trend with November’s job openings at 10.5 million compared to a 22-year high of 11.9 million for March 2022.
|
| Economic Growth | Gross Domestic Product: The “third” estimate for Q3 GDP indicated the economy expanded by 3.2% during the quarter compared to the “second” estimate of 2.9%. The revision is based on more complete source data than was available for the revision released last month. The revision indicated consumer and business spending was even stronger than the prior report while housing activity was worse. There were minor adjustments to inventories while revisions to exports reduced the net exports level. Government spending expanded by 3.7% versus the previous estimate of 3% growth. 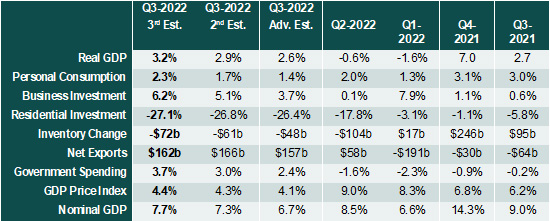
Growth for Q4 is expected to be a little weaker compared to Q3 as 425 basis points in Fed tightening begins to slow the demand for labor. Retail sales have been choppy, and year-over-year sales are trending lower but are still 6.5% higher than a year ago. The housing sector is likely in recession with manufacturing expected to soon follow. The initial report on Q4 GDP will not be released until late January. GDP growth for 2023 is expected to be sluggish with outright economic contraction possible for the first half of the year. |
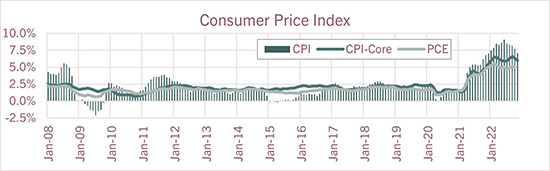
| Consumer Inflation | Consumer Price Index (CPI): Compared to the prior month, overall consumer inflation for December fell 0.1% while volatile food and energy prices were down 0.3% and 4.5%, respectively. Gas prices were down 9.4% while electricity costs rose 1%. Excluding food and energy, the so called core rate of inflation rose 0.3% as shelter costs, which typically have long and variable lags, jumped 0.8%. Offsetting some of those increases were declines in used car prices and airfares. On a year-over-year basis, overall consumer inflation is up 6.5% with core inflation up 5.7%. An indirect input to inflation is labor costs. Year-over-year average hourly earnings have been 4.5% or higher since August 2021. Meanwhile, the annual shelter cost index continues to move higher, rising from 4.4% for January 2022 to 7.4% as of last month with no sign of leveling off. Labor and housing comprise significant components of the inflation complex and until we see meaningful declines in labor and housing inflation will likely remain above the Fed’s 2% target, despite disinflation in other inflation categories.
|
| Monetary Policy | The table below summarizes recent decisions regarding monetary policy action by the Federal Open Market Committee. The next FOMC meeting is scheduled for Jan. 31-Feb. 1, 2023. Federal funds futures indicate a potential for a 25-basis point rate increase. One or two additional 25-basis-point rate hikes are possible during the first half of 2023. Directives to the Open Market Desk at the Federal Reserve Bank of New York 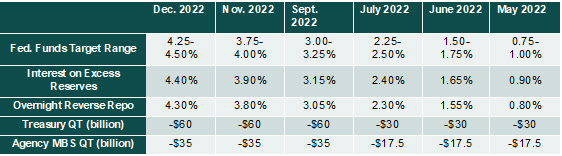 |
The above commentary is a summary of select economic conditions prepared for AgWest Farm Credit management. It is being shared as a courtesy. As with any economic analysis, it is based upon assumptions, personal views and experiences of those who provided the source material as well as those who prepared this summary. These assumptions, conclusions and opinions may prove to be incomplete or incorrect. Economic conditions may also change at any time based on unforeseeable events. AgWest assumes no liability for the accuracy or completeness of the summary or of any of the source material upon which it is based. AgWest does not undertake any obligation to update or correct any statement it makes in the above summary. Any person reading this summary is responsible to do appropriate due diligence without reliance on AgWest. No commitment to lend, or provide any financial service, express or implied, is made by posting this information.